Educational
The 2027 COLA vs. Local Prices: Where 3.6% Beat Prices, and How the COLA Gap Has Shifted
Educational information only. Not financial, legal, or tax advice. Benefora is not affiliated with the Social Security Administration. For your official benefit estimate, visit ssa.gov.
Last Updated: October 14, 2026
On October 14, 2026, the Social Security Administration announced a 3.6% cost-of-living adjustment. It is the largest COLA since the 8.7% paid from January 2023. It applies starting with December 2026 benefits, which are paid in January 2027, and it is the same percentage in every part of the country.
Local prices do not move in step. The Benefora Social Security COLA Gap Index, updated the same morning with the Bureau of Labor Statistics September price data (window Q3 2019 to Q3 2026), compares the COLAs with consumer prices (CPI-U, all urban consumers) in the 23 metro and urban areas for which BLS publishes a local price index. This article looks at the newest COLA on its own, and at how the picture has changed since 2023.
1-on-1 expert review
Claim at 62 instead of 70 and your check is about 43% smaller, for life
Every claiming age from 62 to 70, modeled on your real earnings record and reviewed with you by a Registered Social Security Analyst®.
Offered by our partner MySSAgent. Benefora earns a commission at no extra cost to you.
How to read the "gap." Throughout, the gap is the index's measure: the percent change in the purchasing power of a benefit that rose only by the COLAs, measured against local prices, 100 × (COLA factor ÷ local price ratio − 1). Negative means local prices rose more than the COLAs. It is not a simple subtraction: in Urban Hawaii over the past year, 1.036 ÷ 1.054 − 1 = −1.7%.
Key findings
- Local prices rose faster than the 3.6% COLA in 10 of the 23 areas. Over the July–September windows of 2025 and 2026 (the months BLS publishes for each area), consumer prices rose 5.4% in Urban Hawaii, 4.5% in New York and 4.4% in Seattle, compared with 1.9% in Tampa and 1.3% in Houston. The U.S. city average rose 3.5%.
- In 14 of the 23 areas, the COLA gap has changed direction since 2023. For the COLAs paid from 2021 to 2024, the COLAs fell more than 1 point behind local prices in seven areas. In Tampa, Phoenix and Atlanta, the three COLAs paid since then have run roughly 2 to 3 points ahead of local prices; in Miami they roughly matched them. Meanwhile, seven areas where the earlier COLAs had run more than 1 point ahead (New York, Boston, Philadelphia, Washington, Chicago, Los Angeles and Urban Hawaii) have seen local prices outpace the COLAs since.
- Gaining ground is not the same as catching up. Over the whole period from 2019 to 2026, the COLAs still trail local prices by 4.6 points in Tampa and 4.1 points in Miami. Seattle's gap widened to 3.4 points, putting it in the index's "fell behind by more than 3 points" band, where it was not in the previous edition.
The 3.6% COLA vs. Local Prices Over the Past Year
By law, the COLA is the percentage increase in the national CPI-W (the Consumer Price Index for Urban Wage Earners and Clerical Workers) from its July–September average in the last year a COLA took effect to its July–September average this year, rounded to one decimal place. SSA's worked calculation: (328.746 − 317.265) / 317.265 × 100 = 3.6 percent.
The table compares that national percentage with each area's CPI-U over the same two July–September windows. Areas marked * are priced by BLS only in even months, so their figures rest on August alone; areas priced in odd months use July and September; monthly areas use all three months.
| Area | Local CPI-U, Q3 2025 to Q3 2026 | Gap vs. the 3.6% COLA, pts |
|---|---|---|
| Urban Hawaii | 5.4% | −1.7 |
| New York-Newark-Jersey City, NY-NJ-PA | 4.5% | −0.8 |
| Seattle-Tacoma-Bellevue WA* | 4.4% | −0.7 |
| Philadelphia-Camden-Wilmington, PA-NJ-DE-MD* | 4.2% | −0.6 |
| Washington-Arlington-Alexandria, DC-VA-MD-WV | 4.1% | −0.5 |
| Denver-Aurora-Lakewood, CO | 4.0% | −0.3 |
| Boston-Cambridge-Newton, MA-NH | 3.8% | −0.2 |
| Detroit-Warren-Dearborn, MI* | 3.7% | −0.1 |
| San Diego-Carlsbad, CA | 3.7% | −0.1 |
| Miami-Fort Lauderdale-West Palm Beach, FL* | 3.7% | −0.1 |
| Los Angeles-Long Beach-Anaheim, CA | 3.6% | 0.0 |
| Minneapolis-St.Paul-Bloomington, MN-WI | 3.4% | +0.2 |
| San Francisco-Oakland-Hayward, CA* | 3.4% | +0.2 |
| Riverside-San Bernardino-Ontario, CA | 3.4% | +0.2 |
| Urban Alaska* | 3.3% | +0.3 |
| St. Louis, MO-IL* | 2.9% | +0.6 |
| Dallas-Fort Worth-Arlington, TX | 2.9% | +0.7 |
| Atlanta-Sandy Springs-Roswell, GA* | 2.9% | +0.7 |
| Chicago-Naperville-Elgin, IL-IN-WI | 2.6% | +1.0 |
| Phoenix-Mesa-Scottsdale, AZ* | 2.5% | +1.1 |
| Baltimore-Columbia-Towson, MD* | 2.3% | +1.3 |
| Tampa-St. Petersburg-Clearwater, FL | 1.9% | +1.7 |
| Houston-The Woodlands-Sugar Land, TX* | 1.3% | +2.3 |
| U.S. city average | 3.5% | +0.1 |
Local prices rose faster than 3.6% in 10 of the 23 areas and slower in 13. One year is a short window for a local index, especially for areas measured on a single month, so small differences between areas should not be read as a ranking.
How the COLA Gap Has Shifted Since 2023
The index measures the seven COLAs effective December 2020 through December 2026 against local price growth from Q3 2019 to Q3 2026. Splitting that window at Q3 2023 separates the four COLAs paid from January 2021 through January 2024 (1.3%, 5.9%, 8.7% and 3.2%, together +20.3%) from the three paid since (2.5%, 2.8% and 3.6%, paid from January 2025 through January 2027, together +9.2%).
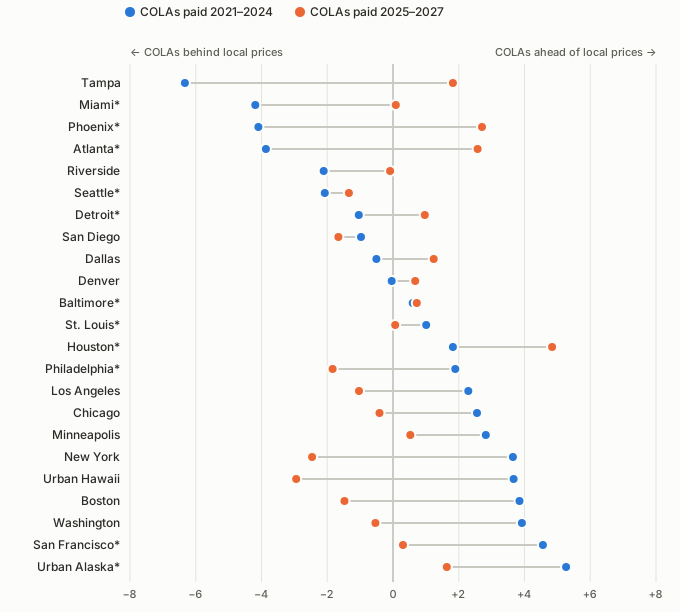
Each point is the change in the purchasing power of a COLA-only benefit against local CPI-U in that period, in percent. Left of zero means local prices rose more than the COLAs. * = BLS prices the area in even months only (August used).
| Area | Gap, COLAs paid 2021–2024 (prices Q3 2019–Q3 2023) | Gap, COLAs paid 2025–2027 (prices Q3 2023–Q3 2026) | Gap, whole period (index) |
|---|---|---|---|
| Tampa-St. Petersburg-Clearwater, FL | −6.3 | +1.8 | −4.6 |
| Miami-Fort Lauderdale-West Palm Beach, FL* | −4.2 | +0.1 | −4.1 |
| Phoenix-Mesa-Scottsdale, AZ* | −4.1 | +2.7 | −1.5 |
| Atlanta-Sandy Springs-Roswell, GA* | −3.9 | +2.6 | −1.4 |
| Riverside-San Bernardino-Ontario, CA | −2.1 | −0.1 | −2.2 |
| Seattle-Tacoma-Bellevue WA* | −2.1 | −1.3 | −3.4 |
| Detroit-Warren-Dearborn, MI* | −1.0 | +1.0 | −0.1 |
| San Diego-Carlsbad, CA | −1.0 | −1.7 | −2.6 |
| Dallas-Fort Worth-Arlington, TX | −0.5 | +1.2 | +0.7 |
| Denver-Aurora-Lakewood, CO | 0.0 | +0.7 | +0.6 |
| Baltimore-Columbia-Towson, MD* | +0.6 | +0.7 | +1.3 |
| St. Louis, MO-IL* | +1.0 | +0.1 | +1.1 |
| Houston-The Woodlands-Sugar Land, TX* | +1.8 | +4.8 | +6.7 |
| Philadelphia-Camden-Wilmington, PA-NJ-DE-MD* | +1.9 | −1.8 | 0.0 |
| Los Angeles-Long Beach-Anaheim, CA | +2.3 | −1.0 | +1.2 |
| Chicago-Naperville-Elgin, IL-IN-WI | +2.6 | −0.4 | +2.1 |
| Minneapolis-St.Paul-Bloomington, MN-WI | +2.8 | +0.5 | +3.4 |
| New York-Newark-Jersey City, NY-NJ-PA | +3.6 | −2.5 | +1.1 |
| Urban Hawaii | +3.7 | −2.9 | +0.6 |
| Boston-Cambridge-Newton, MA-NH | +3.8 | −1.5 | +2.3 |
| Washington-Arlington-Alexandria, DC-VA-MD-WV | +3.9 | −0.5 | +3.4 |
| San Francisco-Oakland-Hayward, CA* | +4.6 | +0.3 | +4.9 |
| Urban Alaska* | +5.3 | +1.6 | +7.0 |
In 14 of the 23 areas the gap has opposite signs in the two periods (in one of them, Denver, the early gap was close to zero). This is a shift, not a clean reversal: across the 23 areas the early and late gaps are only weakly correlated (−0.36), and nine areas kept their direction.
Where the COLAs have gained ground. Seven areas were more than 1 point behind for the COLAs paid 2021–2024. In Tampa (−6.3 to +1.8), Phoenix (−4.1 to +2.7), Atlanta (−3.9 to +2.6) and Detroit (−1.0 to +1.0), the later COLAs ran ahead of local prices. In Miami (−4.2 to +0.1), local prices roughly matched them. In Riverside and Seattle, local prices kept outpacing the COLAs.
The timing differed. In Miami almost all of the early shortfall came in the year to Q3 2023, which set the 3.2% COLA paid from January 2024: Miami's prices rose 7.8% that year. Tampa's largest one-year shortfall came in the same year (prices up 6.3%), after smaller shortfalls in earlier years. In Phoenix and Atlanta most of it came a year earlier, in the year to Q3 2022, which set the 8.7% COLA: prices rose 13.0% in Phoenix and 11.7% in Atlanta.
Where local prices have outpaced the COLAs since 2023. In seven areas where the COLAs paid 2021–2024 ran more than 1 point ahead of local prices, local prices then rose more than the COLAs paid 2025–2027: New York (+3.6 to −2.5), Urban Hawaii (+3.7 to −2.9), Boston (+3.8 to −1.5), Philadelphia (+1.9 to −1.8), Los Angeles (+2.3 to −1.0), Washington (+3.9 to −0.5) and Chicago (+2.6 to −0.4). Other areas that were ahead stayed ahead, including Minneapolis, San Francisco and Urban Alaska (with smaller leads) and Houston, where the lead grew (+1.8 to +4.8).
How robust is the shift?
- With local CPI-W instead of CPI-U (the index's robustness column), it holds: 16 of 23 areas change sign. Tampa, Miami, Phoenix and Atlanta again move from more than 1 point behind to not behind, joined by Dallas and Denver; the same seven areas again move from more than 1 point ahead to behind, joined by Minneapolis.
- Splitting at Q3 2022 instead of Q3 2023 weakens it considerably. The correlation falls to −0.07. Only Phoenix and Atlanta then move from more than 1 point behind to not behind, and Miami goes the other way (+0.1 to −4.2), because its shortfall came after Q3 2022. On the other side, New York, Boston, Los Angeles, Philadelphia and Urban Hawaii, plus Denver and Detroit, move from more than 1 point ahead to behind.
The result depends on where the window is split. We split at Q3 2023 because it separates the four COLAs paid 2021–2024, which include the two largest, from the three since. That is our choice, not a statistical finding.
What the Whole-Period Index Shows Now
Across the full window, the seven COLAs added 31.37% to benefits. The U.S. city average CPI-U rose 30.65%, a gap of +0.55 nationally. Of the 23 areas:
- 7 fell behind local prices by more than 1 point, 3 of them by more than 3 points (Tampa −4.6, Miami −4.1, Seattle −3.4).
- 5 were within 1 point either way.
- 11 were ahead by more than 1 point, the largest gaps in Urban Alaska (+7.0) and Houston (+6.7).
Compared with the previous edition (Q3 2019 to Q3 2025, published in September 2026), Tampa's gap narrowed from −6.2 to −4.6, Miami's was nearly unchanged (−4.0 to −4.1), Seattle's widened from −2.7 to −3.4, and Urban Hawaii's lead shrank from +2.4 to +0.6. Every area, with its counties and the CPI-W check, is on the index page, with a CSV download.
What This Does and Does Not Mean
- It is about price change, not price levels. A positive gap does not mean an area is cheap, and a negative one does not mean it is expensive. BLS area indexes measure how prices changed in an area, not how they compare with other areas.
- It is not "retiree inflation." Local CPI-U covers all urban consumers. BLS publishes no local price index for older households.
- It is not your own benefit. Your benefit rises by the COLA percentage wherever you live. Whether your costs rose faster depends on what you buy, whether you rent or own, and your Medicare premiums. The 2027 Medicare Part B premium has not been announced yet; CMS usually announces it in November.
- Local figures are noisy. BLS does not publish standard errors for metro indexes, and areas priced every other month rest on one or two months per year. Differences of a few tenths of a point should not be read as a ranking.
- October 2025 is not used. BLS could not collect October 2025 data during the federal shutdown. This analysis uses only July–September data, which BLS published in every year.
Method
All figures come from published BLS consumer price indexes (all items, not seasonally adjusted) and SSA's COLA history. For each area, the price level in a year is the average of the July, August and September values BLS publishes for it: all three months for monthly areas, July and September for odd-month areas, August for even-month areas, the same months in every year. The gap is 100 × (COLA factor ÷ local price ratio − 1), where the COLA factor multiplies the COLAs for the period. The two-period gaps compound to the whole-period index figure for every area. Full method, sources and limitations: index methodology and Benefora methodology.
Frequently Asked Questions
What is the Social Security COLA for 2027?
3.6%. SSA announced it on October 14, 2026. It applies to benefits for December 2026, which are paid in January 2027. SSI payment levels rise by the same percentage for January 2027, with those payments made on December 31, 2026. More on how it works: Social Security COLA guide.
Did the 2027 COLA keep up with prices where I live?
Over the same July–September windows SSA uses, local consumer prices (CPI-U) rose faster than 3.6% in 10 of the 23 BLS metro and urban areas, including Urban Hawaii (5.4%), New York (4.5%) and Seattle (4.4%), and slower in 13, including Tampa (1.9%) and Houston (1.3%). The national CPI-U rose 3.5%.
Why is the COLA the same everywhere?
The law ties the COLA to one national index, the CPI-W. SSA does not adjust benefits for local prices.
Where have the COLAs fallen furthest behind local prices since 2019?
In the COLA Gap Index (Q3 2019 to Q3 2026), the COLAs trail local CPI-U by more than 3 points in Tampa-St. Petersburg-Clearwater (−4.6), Miami-Fort Lauderdale-West Palm Beach (−4.1) and Seattle-Tacoma-Bellevue (−3.4).
Next Steps
- The Benefora Social Security COLA Gap Index: every area, counties, CPI-W check and CSV
- Social Security COLA guide: how the COLA is calculated and paid
- IRMAA and Medicare premiums: what comes out of your check before the COLA reaches you
1-on-1 expert review
You know the rules. Now find your best claiming age.
Every age from 62 to 70 modeled on your real earnings record, then reviewed with you by a Registered Social Security Analyst® before you file.
Offered by our partner MySSAgent. Benefora earns a commission at no extra cost to you.
Free tools: Social Security Calculator · Spousal Calculator · Benefit Tax Calculator · Earnings Test Calculator · Life Expectancy Calculator
Free Download
The Social Security Claiming Checklist
A one-page checklist of the decisions and deadlines that determine how much you collect — the 8 things to confirm before you file. Free to your inbox.
No spam. Unsubscribe any time.